


How to Read Forex Charts for Beginners
Written by
| Reviewed by Abdul Latheef K
Last updated on
July 31, 2026
A forex chart is not just a series of lines on a monitor. It represents the actual price movement of a foreign exchange pair in a dynamic fashion.
For individuals entering trading or those beginning to explore technical analysis, learning how to read a forex chart is essential. Beginners can read forex charts by getting familiar with different chart types and chart elements like price and time, identifying trends, and analysing support and resistance.
In this guide, you can find out the basics of forex charts, how to read them, how to identify trends on a forex chart, and other factors.
sec2
What is a Forex Trading Chart
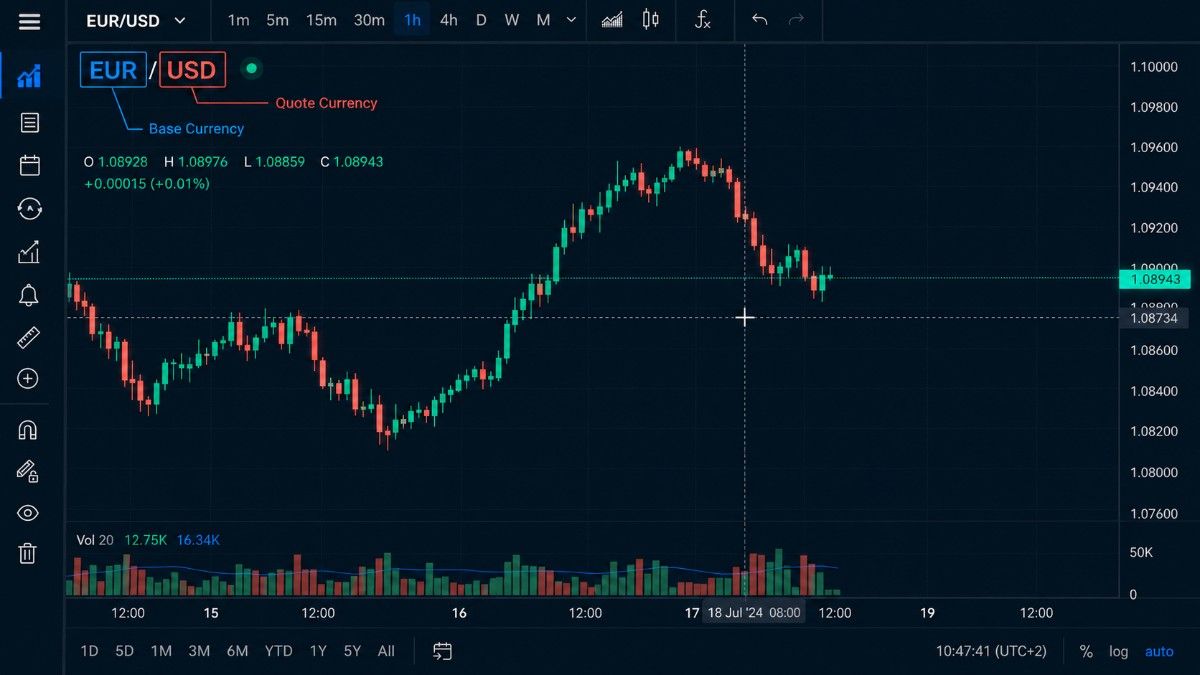
A forex trading chart is a graphical representation of exchange rates for a particular currency pair over time.
Common currency pairs include EUR/USD, GBP/USD, and USD/JPY, which show the association between the base and quoted currencies. For example, in EUR/USD, EUR is the base currency, and USD is the quote currency.
Traders utilise platforms, including TradingView, MetaTrader 4, and MetaTrader 5, to analyse forex charts using tools such as candlestick charts, line charts, and OHLC bar charts.
These charts form the foundation of technical analysis, helping traders to assess price movement, trends, chart pattern recognition, and market behaviour. So, learning chart reading can be helpful before starting a forex trading journey.
sec2
How to Read a Forex Trading Chart
Understanding how to analyse forex charts involves more than just tracking price fluctuations.
Traders who are proficient in chart reading can understand chart structure, price action, trend behaviour, and how buyers and sellers react around important market levels. Platforms such as TradingView, MetaTrader 4, and MetaTrader 5 may have different layouts, but the process of reading charts remains largely the same.
There are three types of charts used by forex traders, namely: Candlestick charts, Line charts, and OHLC (Bar charts). Even though all these charts display price movements, the degrees of information they offer are different.
In this section, let’s have a detailed discussion on how to read different forex charts, understand the components of a chart, learn how to read a forex price quote, and analyse an example of a trader’s chart reading.
How to Read a Candlestick Chart
Candlestick charts are among the most commonly used chart types in forex trading since they present comprehensive information in a visually simple way. The candlestick shows open, high, low, and close (OHLC) prices as well as the struggle between buyers and sellers for a certain period of time.
More than just price data, candlesticks show the battle between buyers and sellers. The candle body, wick, and closing position help traders understand market sentiment, momentum, and possible price direction.
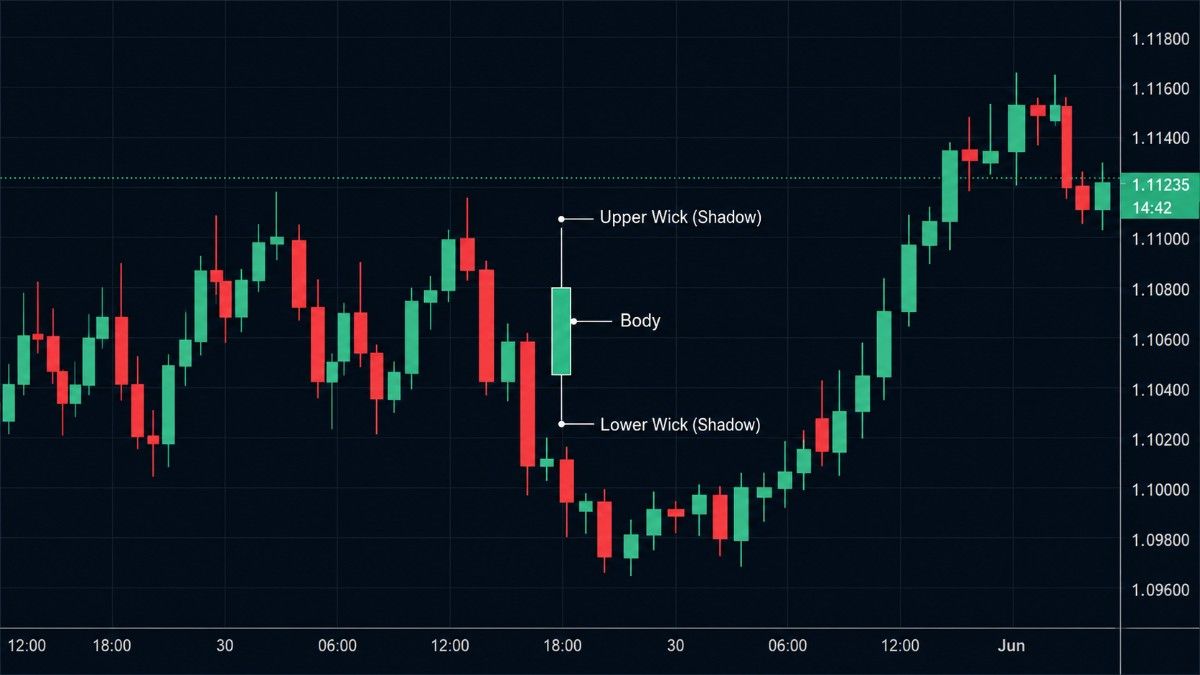
Candlesticks have the following elements:
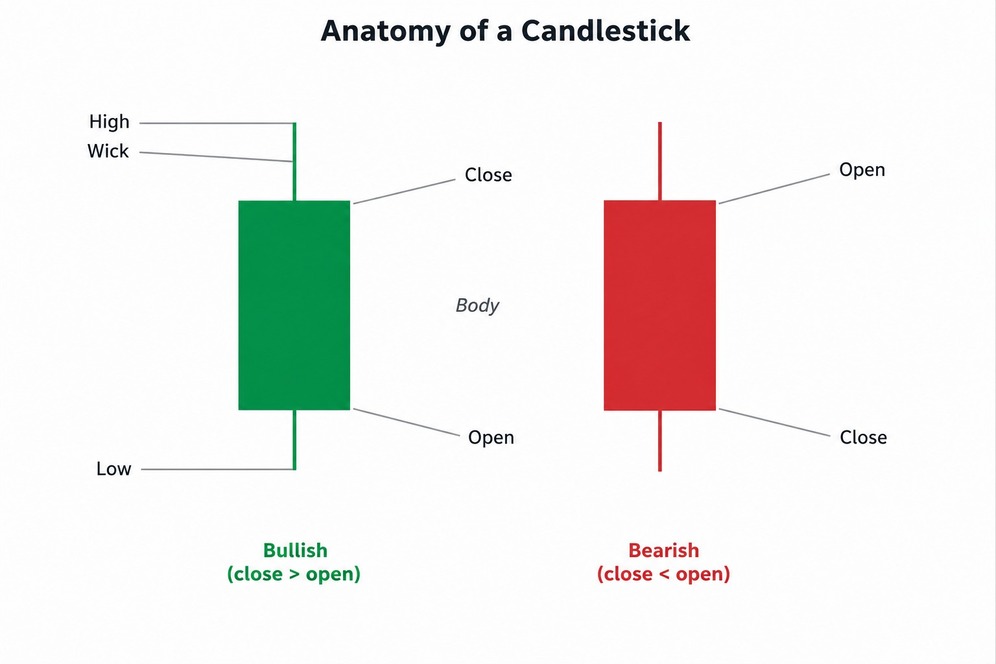
To interpret a candlestick chart, traders usually go through a step-by-step process.
In this chart, GBP/USD moves from around 1.2520 to 1.2780. The candles form higher highs and higher lows, showing that buyers are in control. Small red candles appear as pullbacks, but the overall direction remains upward.
How to Read a Line Chart
A line chart represents a straight line that connects closing prices. Since it removes intraday fluctuations and candle details, traders often use it for quickly identifying broader uptrends, downtrends, or range markets.
Line charts benefit beginners because they make it easy to recognise the direction of the trend while avoiding unnecessary market noise. Nevertheless, they do not display full price action as candlestick charts.
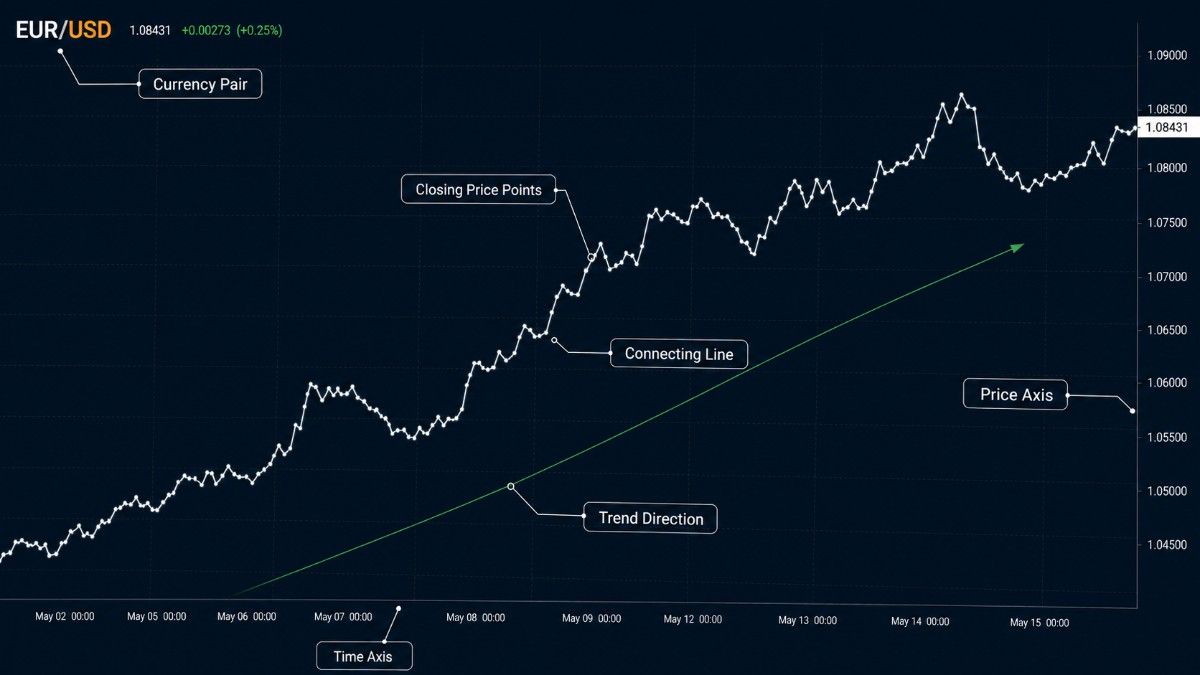
The main components of a line chart include:
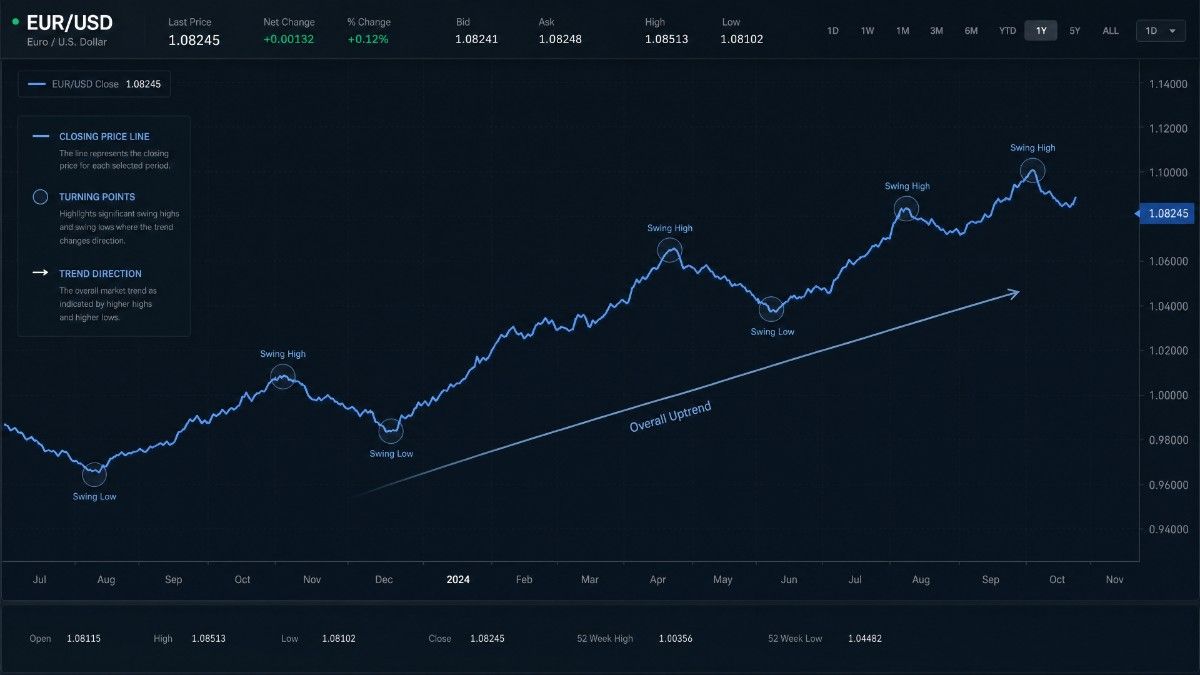
While analysing line charts, traders may usually:
If the line gradually moves upward and creates higher peaks over time, traders may identify an uptrend. If it moves sideways repeatedly between two areas, it may suggest a range market.
As the line charts mainly display closing prices, they are mostly used to identify overall direction rather than precise trade entries.
In this chart, EUR/USD closing prices move between 1.0830 and 1.0920. The price does not make a clear uptrend or downtrend. Instead, it keeps bouncing between the support and resistance levels.
How to Read a Bar Chart
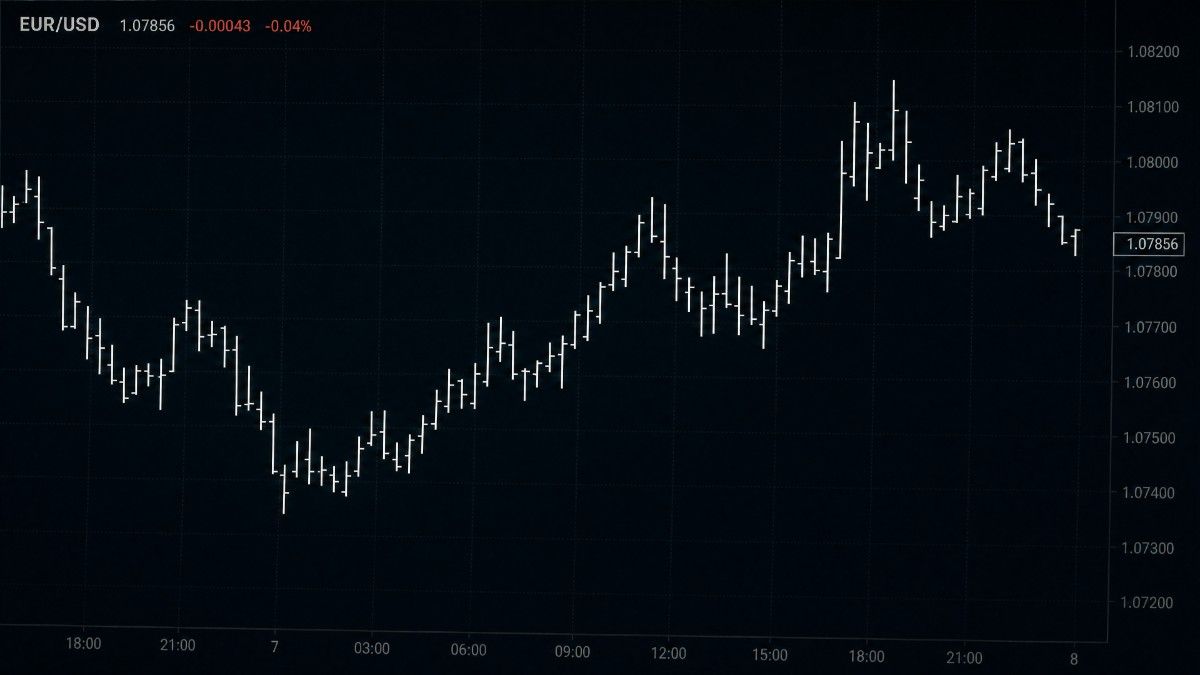
The Bar chart, also known as the OHLC chart, shows open, high, low, and close values through the use of vertical bars. The upper and lower ends of the bars denote the high and low prices recorded for a particular period of time.
The small horizontal line on the left denotes the opening price, while the small horizontal line on the right denotes the closing price. While bar charts are useful for analysing price movements and trends, they are not as visually appealing as candlesticks.
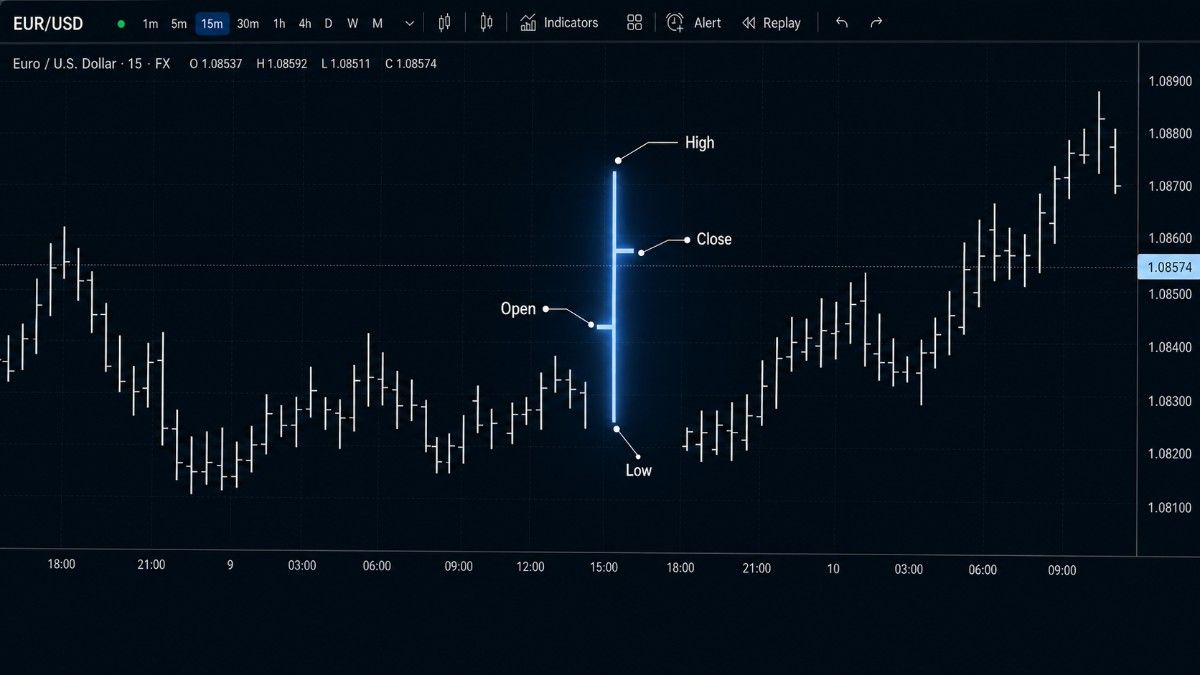
Each bar displays the following information:
Reading a Bar chart involves examining how opening and closing prices correlate and then determining whether bars are getting bigger, smaller, or moving in a particular direction.
Common approaches include:
Bar charts give almost the same data as candlesticks. However, many traders prefer reading candlestick charts because the market behaviour is more visible.
In this chart, AUD/USD moves near the support zone and then starts rising. Several OHLC bars close near their highs, showing that buyers are controlling the move.
sec2
How to Read a Forex Price Quote
It is necessary to know about forex price quotes, as every deal begins with understanding the value of currencies.
For instance:
EUR/USD = 1.0850
Wherein the quote includes:
EUR: Base Currency
USD: Quote Currency
So,
1 EUR = 1.0850 USD
Also, in a forex platform, you can find:
- Bid
- Ask
- Spread
- Pip
- Pipette
For example:
- Bid → 1.0848
- Ask → 1.0850
The difference (0.0002) equals a 2-pip spread.
Some traders use informal market nicknames for currency pairs such as Fiber (EUR/USD), Cable (GBP/USD), Gopher (USD/JPY), Aussie (AUD/USD), and Loonie (USD/CAD, although beginners can focus on standard pair symbols.
sec2
How a Trader Analyses a Forex Chart and Starts a Trade
This is a hypothetical example developed purely for illustrative purposes in order to demonstrate how traders can approach a candlestick chart prior to initiating their trading.
For example, let’s say a trader opens the EUR/USD H4 Candlestick chart on TradingView during the London/New York session overlap, which is typically characterised by higher volatility.
Rather than looking immediately for an opportunity to open a trade, the trader first assesses the general price action and market structure.
In this case, the trader sees that EUR/USD creates higher highs and higher lows, thereby creating an uptrend. Following the identification of a trend, a support level at 1.0820 is found, where the price had previously bounced off multiple times.
When the price starts retracing towards this support level, the trader then looks at recent candlesticks. In this case, a bullish engulfing formation occurs after the formation of multiple lower-wick candles while also closing near the top.
Instead of entering right away, the trader observes whether the EMA slope remains upward and whether the price continues trading above it.
The trader may use several tools for additional context, recognising that indicators provide signals rather than certainty.
This is an example of how traders use candlestick charting techniques to trade.
sec2
How to Identify a Trend on a Forex Chart
One of the key forex trading skills that a trader needs to develop when they read a forex chart is trend identification. It may help traders understand current market direction, although trends can change unexpectedly and do not guarantee future price movement.
In essence, trends identify who, buyers or sellers, are in control of the market. Forex trends generally fall into three categories:
Uptrend: Higher Highs and Higher Lows
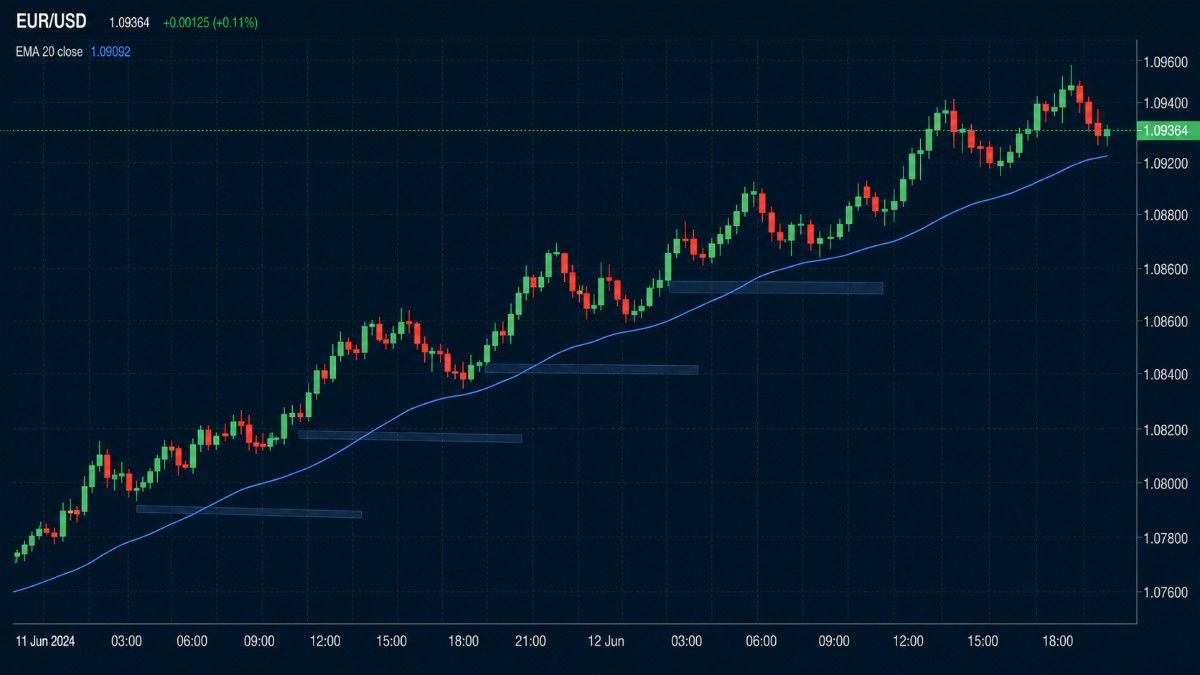
An uptrend happens when the price consistently forms higher highs and higher lows, indicating that there is increased buying power in the market. Traders who engage in trend following or swing trading usually look for entries when prices retrace.
For example, if the EUR/USD pair moves from 1.0800 → 1.0850 → 1.0820 → 1.0900, then the structure continues making higher highs and higher lows.
Signs of uptrends include:
Downtrend: Lower Highs and Lower Lows
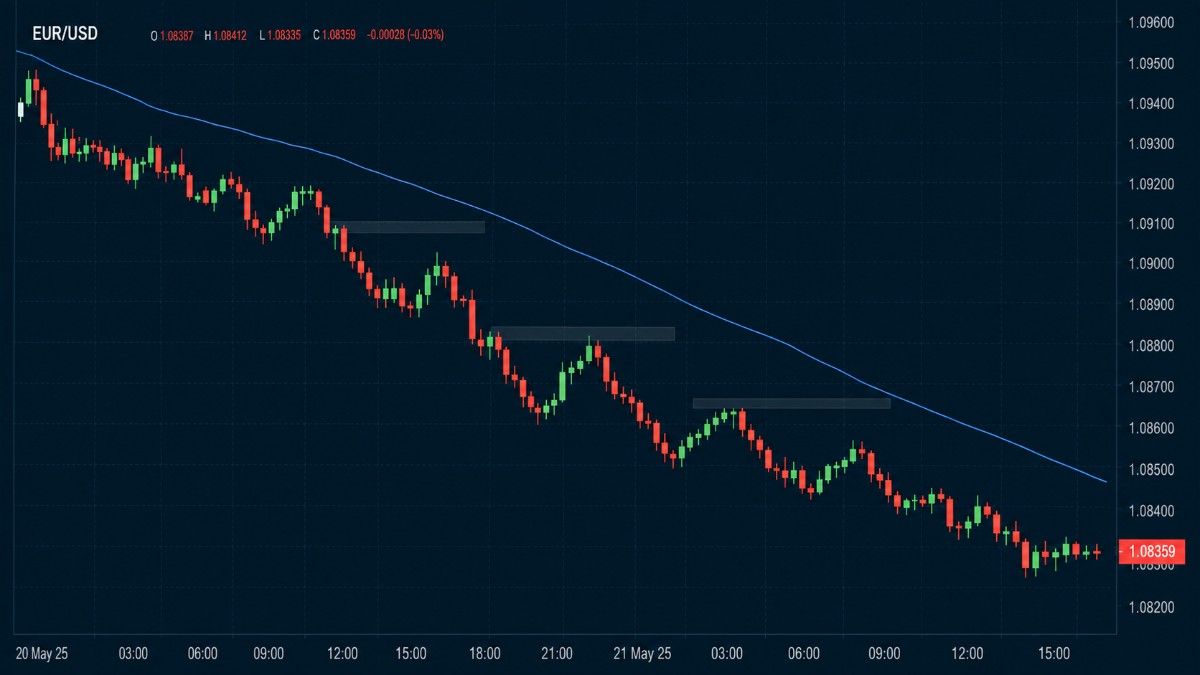
A downtrend is created by price making lower highs and lower lows, showing that there is more selling pressure. Rather than attempting to identify a market bottom, many trend-following traders look for selling opportunities when the price retraces toward resistance levels.
Features of downtrends are:
Sideways or Range Markets
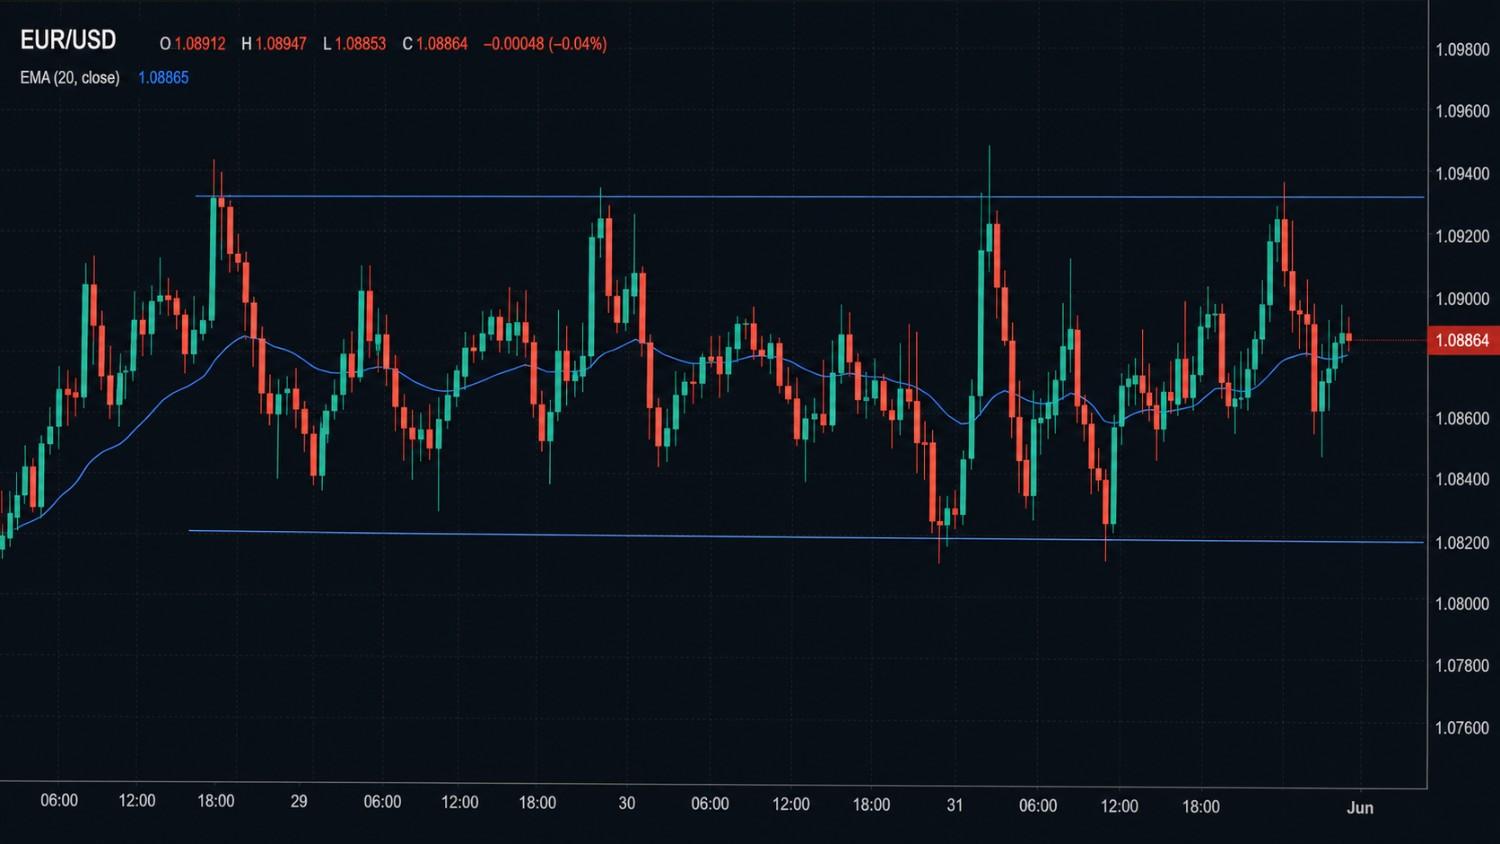
Markets do not always trend. Range markets develop when prices bounce back and forth between support and resistance levels, showing no clear trend direction. This can create uncertainty for traders.
Beginners frequently make mistakes here because range markets can produce false breakouts and trigger FOMO.
Example: Identifying Trends Using Forex Chart Analysis
Assume that a trader is trading EUR/USD in the H4 chart using TradingView. The price starts rising from 1.0750 to 1.0820. After a slight retracement, the price again rises towards 1.0880. Since the chart keeps creating higher highs and higher lows, the trader identifies an uptrend.
Next, the price starts falling and forms lower lows. This suggests a possible downtrend. Later, the price moves within a support-resistance level without any defined direction, suggesting a range market.
By analysing such price action and market structure, traders can identify changing market conditions instead of reacting emotionally to every candle.
sec2
A “chart reading skill ladder”
Forex chart analysis skills development takes time. Many novices may find it difficult at first to quickly identify market activity or chart trends.
Instead, they progress through stages where they first learn to identify chart elements, then understand price movement, and eventually build trading decisions around structured analysis.
It is important to know your current position to help you concentrate on the skills that you require and to read forex charts like a pro.
Stage 1: Recognise
As a beginner, one needs to start by learning the basics of charts and technical analysis. This stage involves recognising different chart elements such as currency pairs, candlestick charts, time frames, and other price action knowledge. It is important to distinguish whether a candle is bullish or bearish as well as locate the X-axis, Y-axis, and current price.
Step 2: Describe
After gaining familiarity with chart elements, traders need to move on to understanding what the price is really doing. Traders may by now learn to describe market behaviour based on trends, uptrends, downtrends, higher highs, lower lows, and market structure.
Instead of randomly looking at the candles, traders may start identifying the behaviour and trends of the currency pairs. This helps improve observation skills and minimise emotional reactions.
Step 3: Predict
With improved understanding, traders move forward to develop their probabilities and make expectations based on price action, support/resistance levels, candles, and indicators such as RSI and EMA.
Traders at this point start recognising certain scenarios that may take place, as well as the way different chart patterns align together.
Step 4: Trade
The last stage includes turning analysis into trading action. Traders may start considering trend direction, support and resistance, candles for confirmation, and risk/reward ratio in advance.
By this stage, decisions become more systematic and are not dependent on emotions. Over time, this process transforms chart reading from confusion into a repeatable trading approach.
sec2
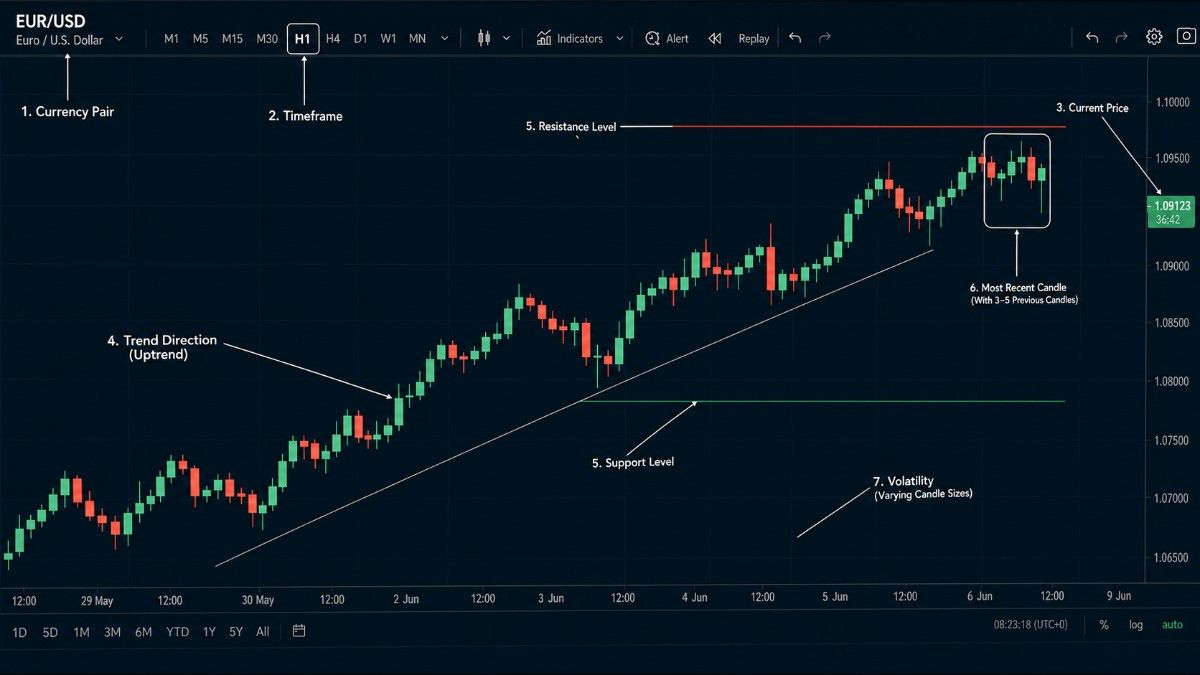
7 things on every forex chart you must identify in under 30 seconds
To understand forex trading charts, experienced traders often spend a few seconds scanning key chart elements before analysing deeper. This simple exercise helps beginners learn how to identify the prevailing market conditions and make objective judgements.
Before entering a trade, train yourself to identify the following seven things:
1. The Currency Pair: Typically located on the upper left side of TradingView and MetaTrader 5. Make sure that the pair you are analysing is your desired pair.
2. The Timeframe: It’s important to identify whether you are dealing with M15, H1, H4 or D1, since the structure varies depending on the timeframe. It can normally be found on the top toolbar.
3. The Current Price: Located on the right side of the chart (Y-axis) and continuously updates with market movement.
4. The Trend Direction: Identified in the main chart area by observing whether the price creates higher highs, lower lows, or moves sideways.
5. The Recent Support & Resistance Levels: Usually drawn across the main chart area near previous highs and lows where the price reacted.
6. The Most Recent Candle (as well as the last 3 or 5 candles): Recent candles usually give some insight into price action. They are found on the far-right side of the candlestick chart.
7. The Volatility: Large candles and long wicks often indicate stronger activity, while smaller candles may suggest lower momentum.
sec2
8 Must-Know Candlestick Patterns for Beginners
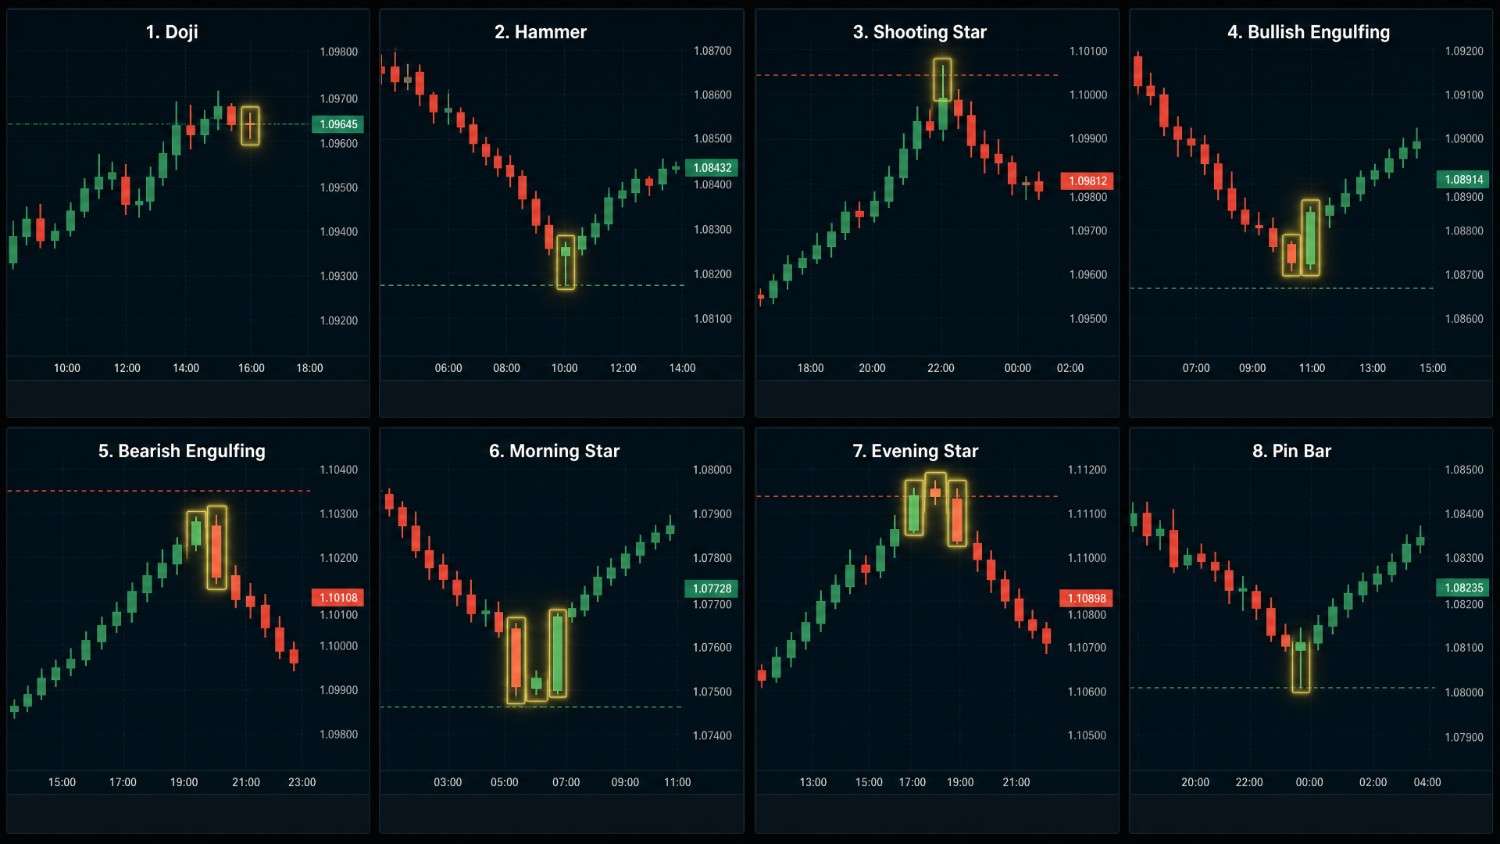
Understanding the basics of candlestick chart reading is crucial to forex chart analysis. Candlestick patterns allow traders to evaluate price movement, momentum reversal, and changes in buyers’ and sellers’ behaviour.
However, patterns become more meaningful when used with trend direction and support-resistance analysis.
Some important candlestick patterns for beginners are as follows:
1. Doji
A doji is a candle with a tiny body due to the equality of opening and closing prices. A doji is a sign of market uncertainty and may indicate a reversal or continuation, depending on the prevailing trend.
2. Hammer
Hammer is a pattern with a small body and a long lower shadow that forms after a downtrend. It suggests buyers stepped in after selling pressure and may signal a bullish reversal near support.
3. Shooting Star
This pattern is formed by a candle with a small body and a long upper shadow that comes after an upward price move. It suggests buyers attempted to push prices higher, but sellers regained control.
4. Bullish Engulfing
The bullish engulfing pattern is formed when a bigger bullish candle engulfs the previous smaller bearish candle. It shows a growing buying pressure and a possible upside momentum.
5. Bearish Engulfing
Bearish engulfing occurs when a big bearish candle fully engulfs the prior bullish candle. This typically indicates building selling pressure and a potential downtrend.
6. Morning Star
Morning star is a three-candle formation that occurs during a downtrend. It demonstrates weakening sell pressure and a possible change in the market’s direction towards a bullish momentum.
7. Evening Star
Evening Star is a three-candle bearish trend reversal pattern that usually occurs following a strong upward momentum. This may signify reduced buying pressure and the beginning of a downtrend.
8. Pin Bar
A pin bar is a candlestick pattern with a long wick and small body, representing the market’s rejection of a particular price level. Traders typically utilise it around support and resistance levels to identify potential reversals.
sec2
How to Practice Reading Forex Charts
Understanding forex trading chart analysis is much more about practice and discipline than memory. A structured practice and consistency may help newcomers develop chart-reading skills without risking real money.
Start with a Demo Account
In a demo account, a trader can trade without fear, as there is no real money at stake.
With the use of platforms like TradingView and MetaTrader 4, beginners can learn how to watch candlestick formations, analyse support and resistance and trade on different time frames.
Chart Replay and Backtesting
Tools like Chart Replay and Backtesting help traders analyse past price action and improve pattern recognition. One can analyse trends, mark support and resistance levels and learn how prices behave around these critical zones.
Develop a Routine and Trading Journal
Spending 20-30 minutes a day analysing one or two currency pairs and noting down trends and recording observations can be helpful in trading. Maintaining a trading journal with screenshots and notes helps identify strengths, mistakes, and recurring patterns over time.
sec4
Conclusion
Learning how to read forex charts is a skill developed through repetition, observation, and structured practice rather than something mastered overnight. Chart interpretation is based on knowledge of price action, market structure, trending behaviour, and support/resistance levels and applying indicators as supplementary tools instead of being guided by the signals only.
Newbies can improve their knowledge with the help of demo accounts, chart playback software, back testing, and trading journaling before starting live trading. The forex market is characterised by high leverage rates that may increase not only profits but also risks; therefore, risk management is equally important to the chart analysis.
Over time and with practice, forex charts may become structured enough to turn into a source of information on trading.
Author Info
Uma Nair is a professional content writer with over 3 years of experience and a strong foundation in crafting engaging and informative content across diverse domains. Over the years, she has dealt with various niches, and her growing interest in finance has led her to explore the world of financial writing. As an English Language and Literature postgraduate, her educational background supports her ability to convey complex topics in easy and accessible content. In her free time, she stays updated on industry trends to continually enhance the value of her content.

Reviewed by
Abdul Latheef K is a Researcher at Jawaharlal Nehru University, New Delhi. He is also an Author, Educator, and Expert in personal finance and Investment. His areas of interest comprise the Stock Market, foreign capital flows, and Open Economy Macroeconomics.
Disclaimer:
The information provided on this blog is for general informational and educational purposes only and is not intended as financial, investment, legal, or tax advice. While we strive to ensure accuracy, completeness, and timeliness, the financial world is dynamic, and content may become outdated or subject to change. Always conduct your own research or consult with a qualified financial advisor before making any investment or financial decisions. The authors and publishers of this blog are not liable for any losses or damages arising from the use or reliance on the information presented.
sticky end
Recent Posts

Share this post
Pages
Plans
Legal
Zyvest Capital Prime Ltd (www.zyvest.com) is licensed and regulated by the Financial Services Commission (FSC) of Mauritius as an Investment Dealer (Full Service Dealer, Excluding Underwriting) under Licence No. GB25204874 | Code: SEC-2.1B, issued on 29 August 2025.
Risk Statement : An investment in derivatives may mean investors may lose an amount even greater than their original investment. Anyone wishing to invest in any of the products mentioned in www.zyvest.com should seek their own financial or professional advice. Trading of securities, forex, stock market, commodities, options and futures may not be suitable for everyone and involves the risk of losing part or all of your money. Trading in the financial markets has large potential rewards, but also large potential risk. You must be aware of the risks and be willing to accept them in order to invest in the markets. Don’t invest and trade with money which you can’t afford to lose. Forex Trading are not allowed in some countries, before investing your money, make sure whether your country is allowing this or not.
You are strongly advised to obtain independent financial, legal and tax advice before proceeding with any currency or spot metals trade. Nothing in this site should be read or construed as constituting advice on the part of Zyvest Capital Ltd. or any of its affiliates, directors, officers or employees.
Contracts for Difference (CFDs) are complex financial instruments and come with a high risk of losing money rapidly due to leverage. A significant percentage of retail investor accounts lose money when trading CFDs with providers. You should consider whether you understand how CFDs work and whether you can afford to take the high risk of losing your money.
CFDs are not suitable for all investors. Ensure you fully understand the risks involved and seek independent advice if necessary. Past performance is not a reliable indicator of future results. Please read our full Risk Disclosure Statement, Terms and Conditions, and Privacy Policy before engaging in any trading activity.
Disclaimer : Zyvest Capital Ltd. does not provide services for citizens/residents of the United States, Cuba, Iraq, Myanmar, North Korea, Sudan. The services of Zyvest Capital Ltd. are not intended for distribution to, or use by, any person in any country or jurisdiction where such distribution or use would be contrary to local law or regulation.