

A Comprehensive Guide on How to Read Forex Trading Charts
Written by
Last updated on
November 12, 2025
sec1
Traders worldwide struggle to learn how to read forex trading charts at the beginning of their learning phase. Mastering the art of reading forex charts is critical to understanding forex trading charts and patterns. Learning chart patterns enables traders to capitalise on trading opportunities and navigate the complexities of the currency market efficiently.
Successful trading requires a blend of knowledge, technical analysis, and strategies. But understanding these crucial three factors comes down to learning forex trading charts. Learning to read the trading charts is the key aspect of understanding the price of currency pairs.
This guide navigates the complexities of learning to read forex charts so that everyone can understand them. If you are a beginner or an average trader, reading this comprehensive guide will help you gain valuable insights into successful forex trading. Dive right into the world of forex charts to improve your chart reading abilities.
sec2
Understanding the forex trading charts
Forex trading charts are a visual representation of the price movements of the currency markets over time. Analysing forex trading charts is critical for any trader who wants to effectively navigate the currency market dynamics.
Forex trading charts provide a graphical representation of price changes over time. The price chart’s x-axis represents the time scale, and the y-axis represents the currency price scale. Price charts allow traders to view the history of price movements. Traders can obtain complete data on the price movement throughout the years.
Forex charts aim to provide a critical understanding of market trends and patterns, ensuring that traders use both technical and fundamental tools to identify potential trading opportunities. Traders can determine where to invest their funds by making a calculative prediction of price movements.
Forex charts can be found on nearly every trading platform. These days, the software offers free live forex trading charts, enabling traders to follow real-time changes in currency prices. Furthermore, it provides a wide range of applications and features for traders to conduct technical analysis to improve trading decisions.
sec3
Types of price charts and how to read them
Price charts come in various forms, from basic line charts to sophisticated candlesticks and specialised charts. These charts offer different insights into the price movements and other aspects of forex market.
Here, we will delve further to understand their structures, functions, and how they enhance trading strategies. The following are the different types of trading charts.
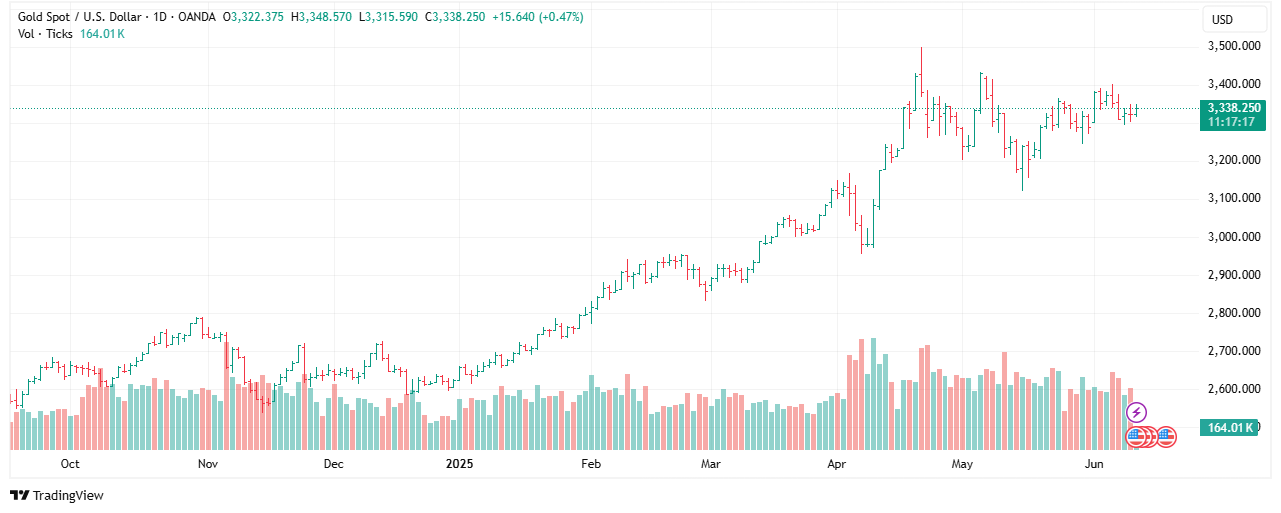
1. Candlestick chart
A candlestick chart is a visual representation of price changes in a forex or any other market where prices keep changing. The chart is generated with candles placed next to each other as the price changes in the market.
Each candle represents the price movements of the respective currency pairs or the security over a specified period. The body of the candlestick represents the opening and closing prices, and the lines (wicks) show the high and low during that period.
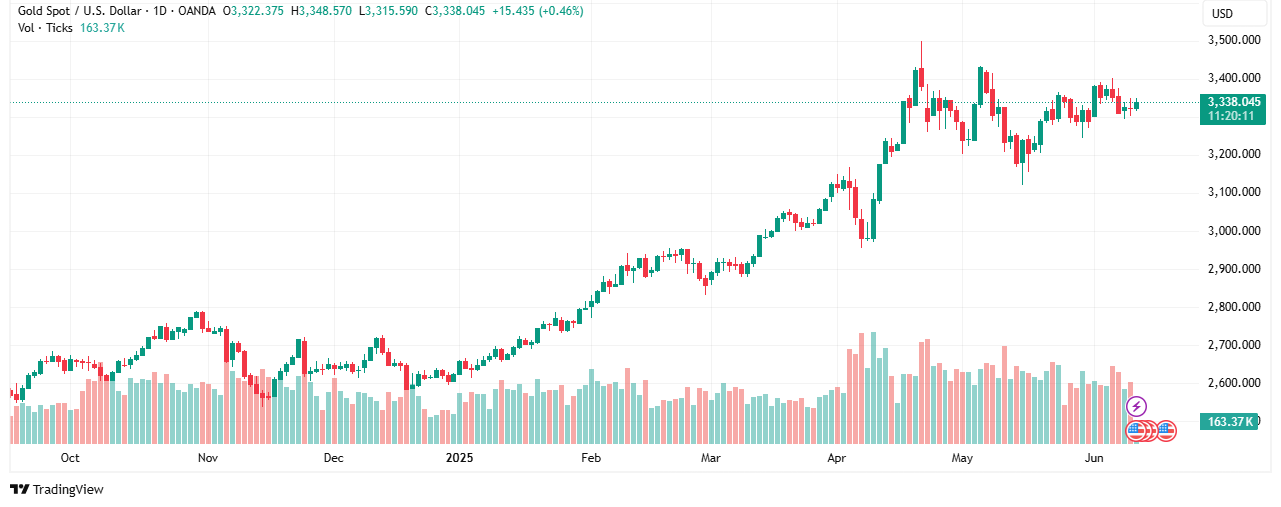
Red and green are the colours associated with candle sticks.
Candlestick charts are one of the most commonly used forms of chat readings. It is a powerful tool to help traders identify market trends, reversals, and potential entry and exit points based on the data.
Reading candlestick chart
Traders can use coloured candles in a candlestick chart pattern to analyse price movements. Colour representations distinguish rising and falling candles. A green candle indicates that the price is rising. Meanwhile, a red candle represents that the price is falling.
Moreover, each candle’s wick can be used by traders to determine the buying and selling pressure. The highs and lows of a currency pair traded at the specified time are represented by the top and bottom wicks of the candles.
The length of the wicks helps to identify market trends.
With the aid of these signals, a trader will be able to recognise bullish and reversal signals and make thoughtful trading decisions. Learning how to read candlestick charts and understand market dynamics will help you navigate the complexities of the market.
2. Line chart
A line chart is a simple type of chart that displays price movements in the forex market. It is formed by connecting the closing prices of each interval with a line. A line chart is a fundamental tool for visualising price trends and identifying key market levels, such as resistance and support.
A line chart shows the closing price of a currency pair at each point over time. Line charts are useful for long-term analysis and countering market trends.
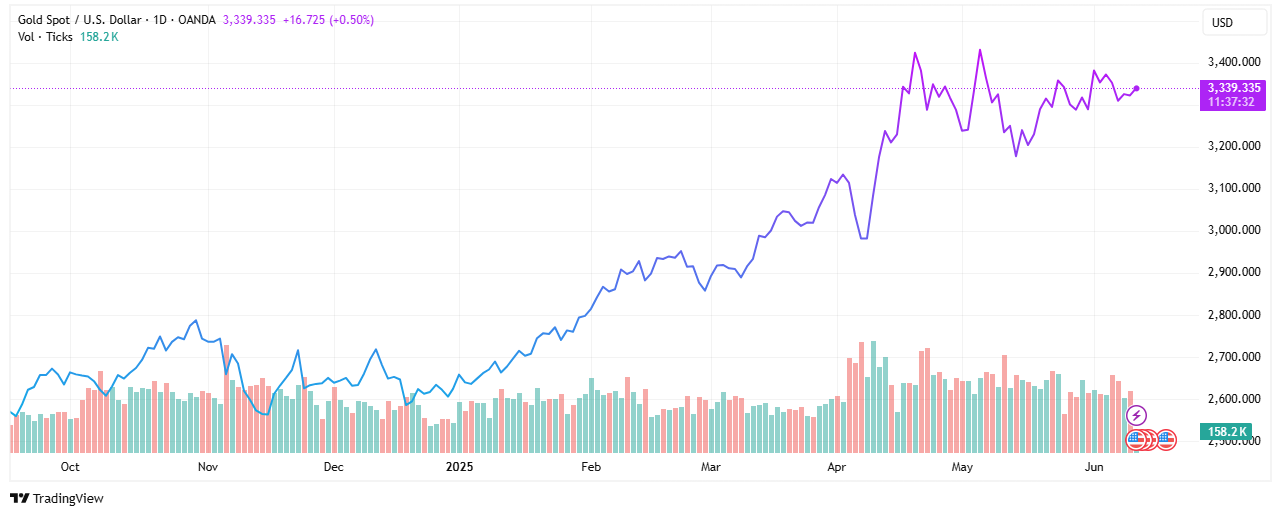
A line chart is simple to interpret as it is straightforward, making it easy for beginners to analyse forex trading charts. Line charts can be combined with other technical analysis tools, such as trend lines and indicators, to identify potential trending opportunities.
Reading line chart
A line chart is displayed on a graph with two axes: the X-axis represents the time frame and the Y-axis represents price. Each point on the line represents the closing price of a currency pair for a specific period.
When a line is consistently moving upward, it indicates that the price of the currency pairs is rising over time. Meanwhile, when the line moves downward, it indicates that the price has been decreasing.
Price predictions in line charts are identified using support and resistance levels. The support level is where the price regularly falls and bounces back up, while the resistance level is when a price stops rising and dips back down.
3. Bar chart
A kind of forex reading chart called a bar chart displays the graphical depiction of a currency pair’s trading activity over a given period of time. It offers traders the ability to analyse the price movements of a certain currency pair. Bar charts suggest volatility, price action, and long-term market swings.
A bar chart is filled with bars that represent the different price ranges of a currency pair, such as open, close, high, and low.
Traders can utilise bar charts for analysing patterns and formation of the potential price movements. Bar charts can be customised to different time frames as per traders’s preferences and strategies, like other charts.
Reading bar chart
Bar chart reading is not as complicated as it seems. Each bar has two horizontal lines, one to the right and the other to the left.
The horizontal line to the left of the bar chart shows the opening price at the beginning of the period, and the horizontal line to the right of the bar shows the closing price at the end of the respective time period.
Each bar is coloured green and red. A green bar indicates that the closing price is higher than the opening price, and a red bar displays that the closing price is lower than the opening price. The ends of the bars represent highs and lows.
4. Heikin-Ashi chart
The Heikin Ashi chart is a financial chart widely used in trading to filter out market noise and adapt to market trends more effectively. The term “Heiken Ashi” refers to the average pace in Japanese. Heikin-Ashi is considered a better forex reading chart than the traditional candlestick.
It is similar to a candlestick with a body and wicks. However, Heikin-Ashi charts are read differently than candlestick charts.
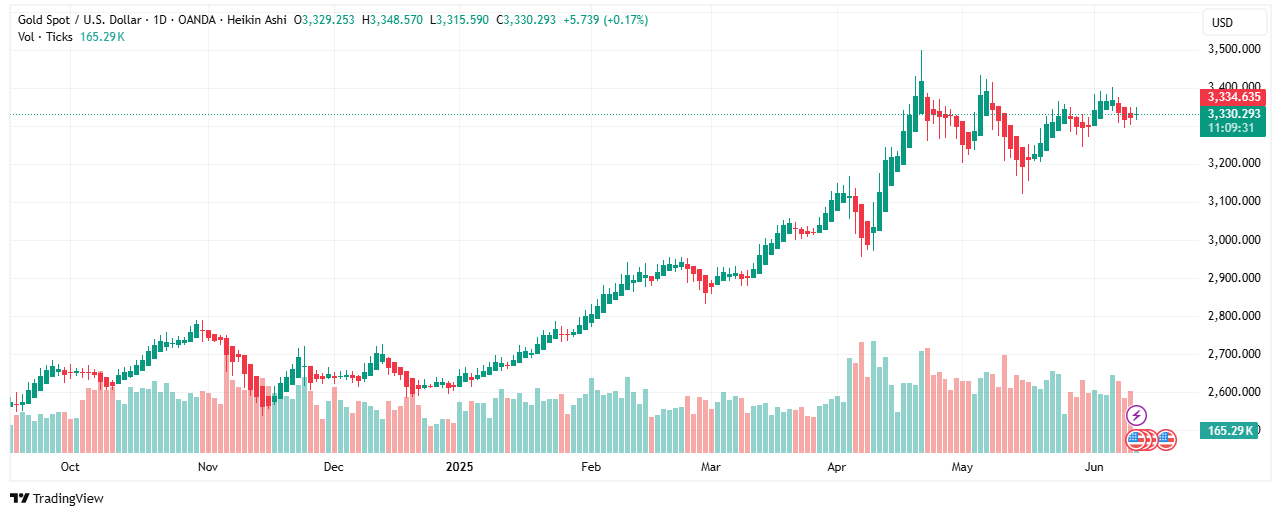
Heiken-Ashi uses a modified calculation to identify the open, close, high, and low prices in the chart. The green and red colours represent the bullish and bearish trends, respectively. The following is how this chart identifies the price movements:
Heikin Ashi charts are used in conjunction with other analysis tools to smooth out the price movements and get rid of the noise to identify trends and reversals.
5. Renko chart
The Renko chart is another type of advanced trading chart designed to analyse price movements. It does not focus on the timeline of the trades like other traditional reading charts.
Renko charts are composed of bricks. A new brick is formed when the price moves to a specified price amount, positioned at a 45-degree angle up or down to the right side of the previous brick. Bricks are formed in two colours, green and red. A green brick indicates an upward trend, and a red brick indicates a downward trend.
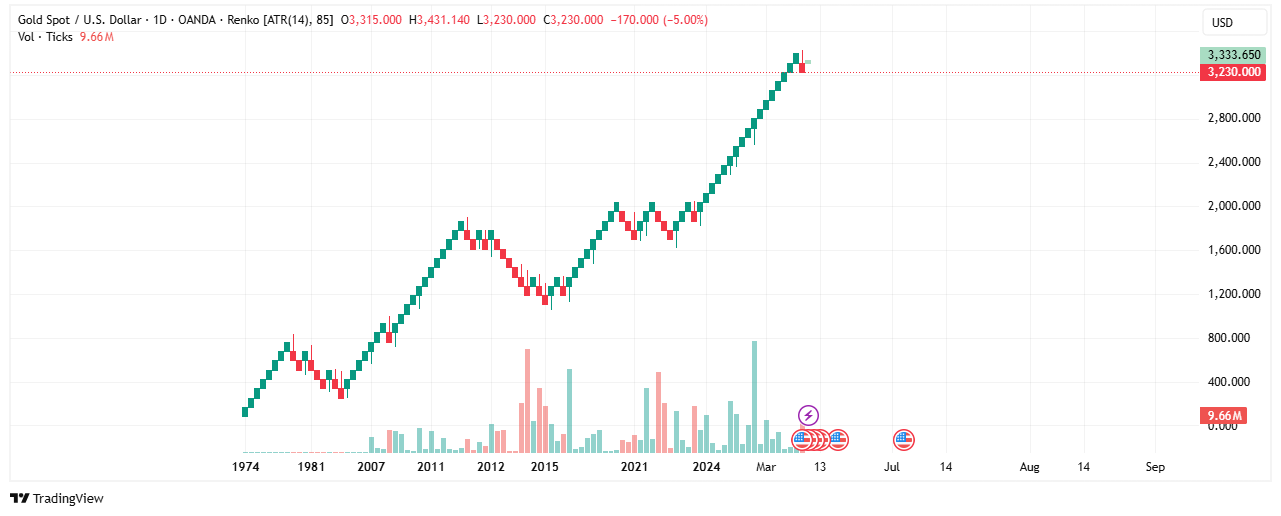
Each brick represents a fixed price movement. Traders can set the brick price to certain points, and when the brick moves up the specified points, a new brick is added to the right side of the previous one.
The Renko chart offers several benefits in chart analysis, as it helps to filter out noise and focus on significant price movements. Since each brick is formed after a certain price movement, it eliminates minor price fluctuations. This allows traders to identify market trends more effectively.
Continuous learning and adaptation will help you understand forex trading charts. Mastering any of these forex reading charts will help you understand the complexities of market dynamics and enable you to make informed trading decisions.
sec4
Techniques for chart analysis
Mastering chart reading is crucial for successful trading. Mastering chart reading requires a blend of technical and analytical tools. Analysing price movements with the help of fundamental tools may help to make more accurate decisions. Some of the technical indicators that are widely used to analyse charts are given below.
1. Support and resistance levels
Support and resistance levels are two crucial technical analyses that help identify potential buying and selling interest. Support and resistance levels are created horizontally on the graph to analyse potential price movements using patterns.
Support levels are identified at the bottom of previous lows, where traders often consider them to be the lowest level before they are expected to bounce back. Meanwhile, a resistance level acts as a ceiling for the price when supply is strong enough to reverse an uptrend. Traders often anticipate whether to short or sell near resistance levels.
2. Identifying Trendlines
Drawing trend lines to connect the higher lows in an uptrend or lower highs in a downtrend helps to visualise the direction of the price. Trend directions can also be identified using moving averages by smoothing out the price data to identify trend directions.
3. Chart patterns
Chart patterns are distinct formations and shapes that appear in patterns, which indicate the expected movement of prices in the future. These are normally formed while the price of a currency pair or a security consolidates in a range without properly making a decisive trend either upward or downward. Understanding chart patterns may help traders identify a potential trend reversal from bullish to bearish or vice-versa.
A multitude of chart patterns are available for traders to utilise. Learning all kinds of chart patterns would be highly useful for traders to even grab the slightest potential trading opportunity.
sec5
Benefits of forex trading charts
Some of the benefits of reading forex charts are given below:
Price movement analysis – Mastering chart reading helps to recognise patterns and identify market trends. Charts reveal various pattern formations; analysing these patterns will help identify the market direction.
Entry and Exit points – Charts allow traders to discover entry and exit points using the key levels of resistance and support. Resistance and support levels are where prices historically reverse or break out. With these tools, traders can manage their movement by making breakout or pullback opportunities.
Risk management – Reading forex charts visually represents the movements of price and volatility over time. Traders can assess market trends, adjust their positions and sizes according to the market trends, and manage risks efficiently.
sec7
Conclusion
In this comprehensive guide to “How to Read Forex Charts,” we have highlighted all the critical instructions for mastering Forex chart reading. You may not instantly master your forex reading abilities. However, continuous learning and practising trading using different charts will help you gain knowledge and insights on various charts.
To put it another way, learning to read a few charts rather than all of them could be beneficial. Mastering some forex charts entails learning and applying techniques for effectively interpreting market behaviour. A good chart reader can navigate the complexities of market dynamics and achieve long-term trading success by creating strategic decisions based on data-driven insights.
Continuous chart learning and integrating strategies and risk management principles can navigate the market efficiently to gain trading success. Therefore, learning market charts is crucial for analysing and implementing relevant trading strategies to smooth out trading decisions. Remember all the techniques discussed above are pertaining to normal market conditions. In the event of abnormal volatility due to some unusual events having geopolitical advance, the usual techniques may not work the way it work otherwise.
Happy Trading..!!!
Author Info
Abdul Latheef K is a Researcher at Jawaharlal Nehru University, New Delhi. He is also an Author, Educator, and Expert in personal finance and Investment. His areas of interest comprise the Stock Market, foreign capital flows, and Open Economy Macroeconomics.
Disclaimer:
The information provided on this blog is for general informational and educational purposes only and is not intended as financial, investment, legal, or tax advice. While we strive to ensure accuracy, completeness, and timeliness, the financial world is dynamic, and content may become outdated or subject to change. Always conduct your own research or consult with a qualified financial advisor before making any investment or financial decisions. The authors and publishers of this blog are not liable for any losses or damages arising from the use or reliance on the information presented.
sticky end
Recent Posts
Share this post
Pages
Plans
Legal
Zyvest Capital Prime Ltd (www.zyvest.com) is licensed and regulated by the Financial Services Commission (FSC) of Mauritius as an Investment Dealer (Full Service Dealer, Excluding Underwriting) under Licence No. GB25204874 | Code: SEC-2.1B, issued on 29 August 2025.
Risk Statement : An investment in derivatives may mean investors may lose an amount even greater than their original investment. Anyone wishing to invest in any of the products mentioned in www.zyvest.com should seek their own financial or professional advice. Trading of securities, forex, stock market, commodities, options and futures may not be suitable for everyone and involves the risk of losing part or all of your money. Trading in the financial markets has large potential rewards, but also large potential risk. You must be aware of the risks and be willing to accept them in order to invest in the markets. Don’t invest and trade with money which you can’t afford to lose. Forex Trading are not allowed in some countries, before investing your money, make sure whether your country is allowing this or not.
You are strongly advised to obtain independent financial, legal and tax advice before proceeding with any currency or spot metals trade. Nothing in this site should be read or construed as constituting advice on the part of Zyvest Capital Ltd. or any of its affiliates, directors, officers or employees.
Contracts for Difference (CFDs) are complex financial instruments and come with a high risk of losing money rapidly due to leverage. A significant percentage of retail investor accounts lose money when trading CFDs with providers. You should consider whether you understand how CFDs work and whether you can afford to take the high risk of losing your money.
CFDs are not suitable for all investors. Ensure you fully understand the risks involved and seek independent advice if necessary. Past performance is not a reliable indicator of future results. Please read our full Risk Disclosure Statement, Terms and Conditions, and Privacy Policy before engaging in any trading activity.
Disclaimer : Zyvest Capital Ltd. does not provide services for citizens/residents of the United States, Cuba, Iraq, Myanmar, North Korea, Sudan. The services of Zyvest Capital Ltd. are not intended for distribution to, or use by, any person in any country or jurisdiction where such distribution or use would be contrary to local law or regulation.