

Forex Technical Analysis Explained: Concepts, Tools, Strategies & Common Mistakes
Written by
| Reviewed by Abdul Latheef K
Last updated on
March 7, 2026
sec1
Have you ever stared at the charts, lines, and patterns in the forex, wondering what all these candles, wicks, and lines really mean? This might have been the situation of most beginners.
Simply put, these charts, lines, and patterns are all part of the technical analysis in forex trading, a major approach used for understanding market movements and making price predictions. Technical analysis is a skill where traders learn to read price charts and market data through technical data rather than relying completely on fundamental analysis and anticipations based on trading news.
If you are new to all this, this guide will walk you through the details of technical analysis. You can learn what forex technical analysis is, its core concepts, popular tools, a step-by-step guide on technical analysis strategy, and certain common mistakes to avoid.
So, together, let’s unwind the question: what is technical analysis in forex trading?
sec2
What is technical analysis in forex trading?
Technical analysis involves the study of historical price movements, charts, and, at times, even trading volume to make more educated decisions about future price direction. As opposed to trading on guesswork, you use chart analysis and technical indicators to understand what the market is already telling you.
This process mainly involves analysing currency pairs like EUR/USD, GBP/JPY, USD/CAD, or others, identifying whether the market is inclined towards buyers or sellers, and more. The core belief is that price reflects supply, demand and market psychology, so recurring price patterns on a forex chart can offer clues about potential future moves.
So, learning technical analysis before starting forex trading can make a huge difference in how you understand the market and manage your trades.
Some key points of technical analysis in forex for beginners include:
sec2
Core building blocks of forex technical analysis
Forex technical analysis is built on some core factors. From charts and trends to zones and volatility, these factors together help read the forex chart, understand market price movements, and build a logical trading strategy.
Here are the details of some of these factors:
1. Price chart and timeframes
Forex technical analysis begins by reading the chart. Traders primarily use candlestick charts as a means of describing price action clearly.
You see the main direction on higher timeframes and then refine your entries on the lower ones.
2. Trends – uptrend, downtrend, and range
Your first question about any forex chart is whether it’s trending or ranging.
Traders often think in terms of short-, medium-, and long-term trends to appropriately fit their trading strategy with the broader market direction.
3. Support and resistance zones
Support and resistance are zones wherein the price often reacts.
When resistance breaks and holds, it often becomes new support and vice versa. These zones help you to plan entries, exits, and stop losses more systematically.
4. Volatility and volume
Volatility is a measure of how much and how quickly the price moves over a period of time.
Other platforms also display forex volume or tick volume (frequency of price changes), which traders often use to support or filter breakout and strong-move setups. Many traders will not enter new trades right before major news events, as market volatility and stop-out risk can jump suddenly.
sec2
Popular technical tools in forex trading
Familiarising yourself with the tools that experienced forex traders use daily helps you understand the types of technical analysis in forex. Whether you trade on TradingView, MetaTrader 4, MetaTrader 5, or others, these tools convert the raw price on a forex chart into more understandable forex signals around which you may develop a straightforward trading strategy.
So, let’s have a closer look at the following technical analysis tools.
1. Moving averages
A moving average is a simple technical indicator that smooths out noisy price action so you can see the overall trend direction more clearly. Instead of reacting to every spike, you read the “average” market price over a set period and decide whether the market is generally rising, falling, or moving sideways.
Traders often use a “fast” moving average in combination with a “slow” one. When the fast line is above the slow line, it supports an uptrend; if it drops below, that may give notice that a trend is weakening or reversing.
Key supporting ideas:
2. Oscillators (RSI, Stochastic, MACD)
Oscillators sit below your main chart and help you judge momentum rather than trend direction. They are especially useful when the price looks stretched after a strong move.
For example, an RSI above 70 suggests the price may be overbought; below 30 suggests it may be oversold. That doesn’t mean instant reversal, but it warns you to be more careful with new entries.
The stochastic and MACD play a similar role: they show how strong or tired a move is and can help you avoid chasing price at the worst possible moment.
Key supporting ideas:
3. Trend lines and channels
Trend lines are simple lines that you draw directly on the chart to show the backbone of market structure. You connect higher lows in an uptrend, and you connect lower highs in a downtrend.
Each touch shows where supply and demand keep reacting, which tells you how traders are thinking and where they’re likely to step in again.
When adding a parallel line, you add a channel. Price often swings between the two lines, creating a visual “road” for the trend.
Key supporting ideas:
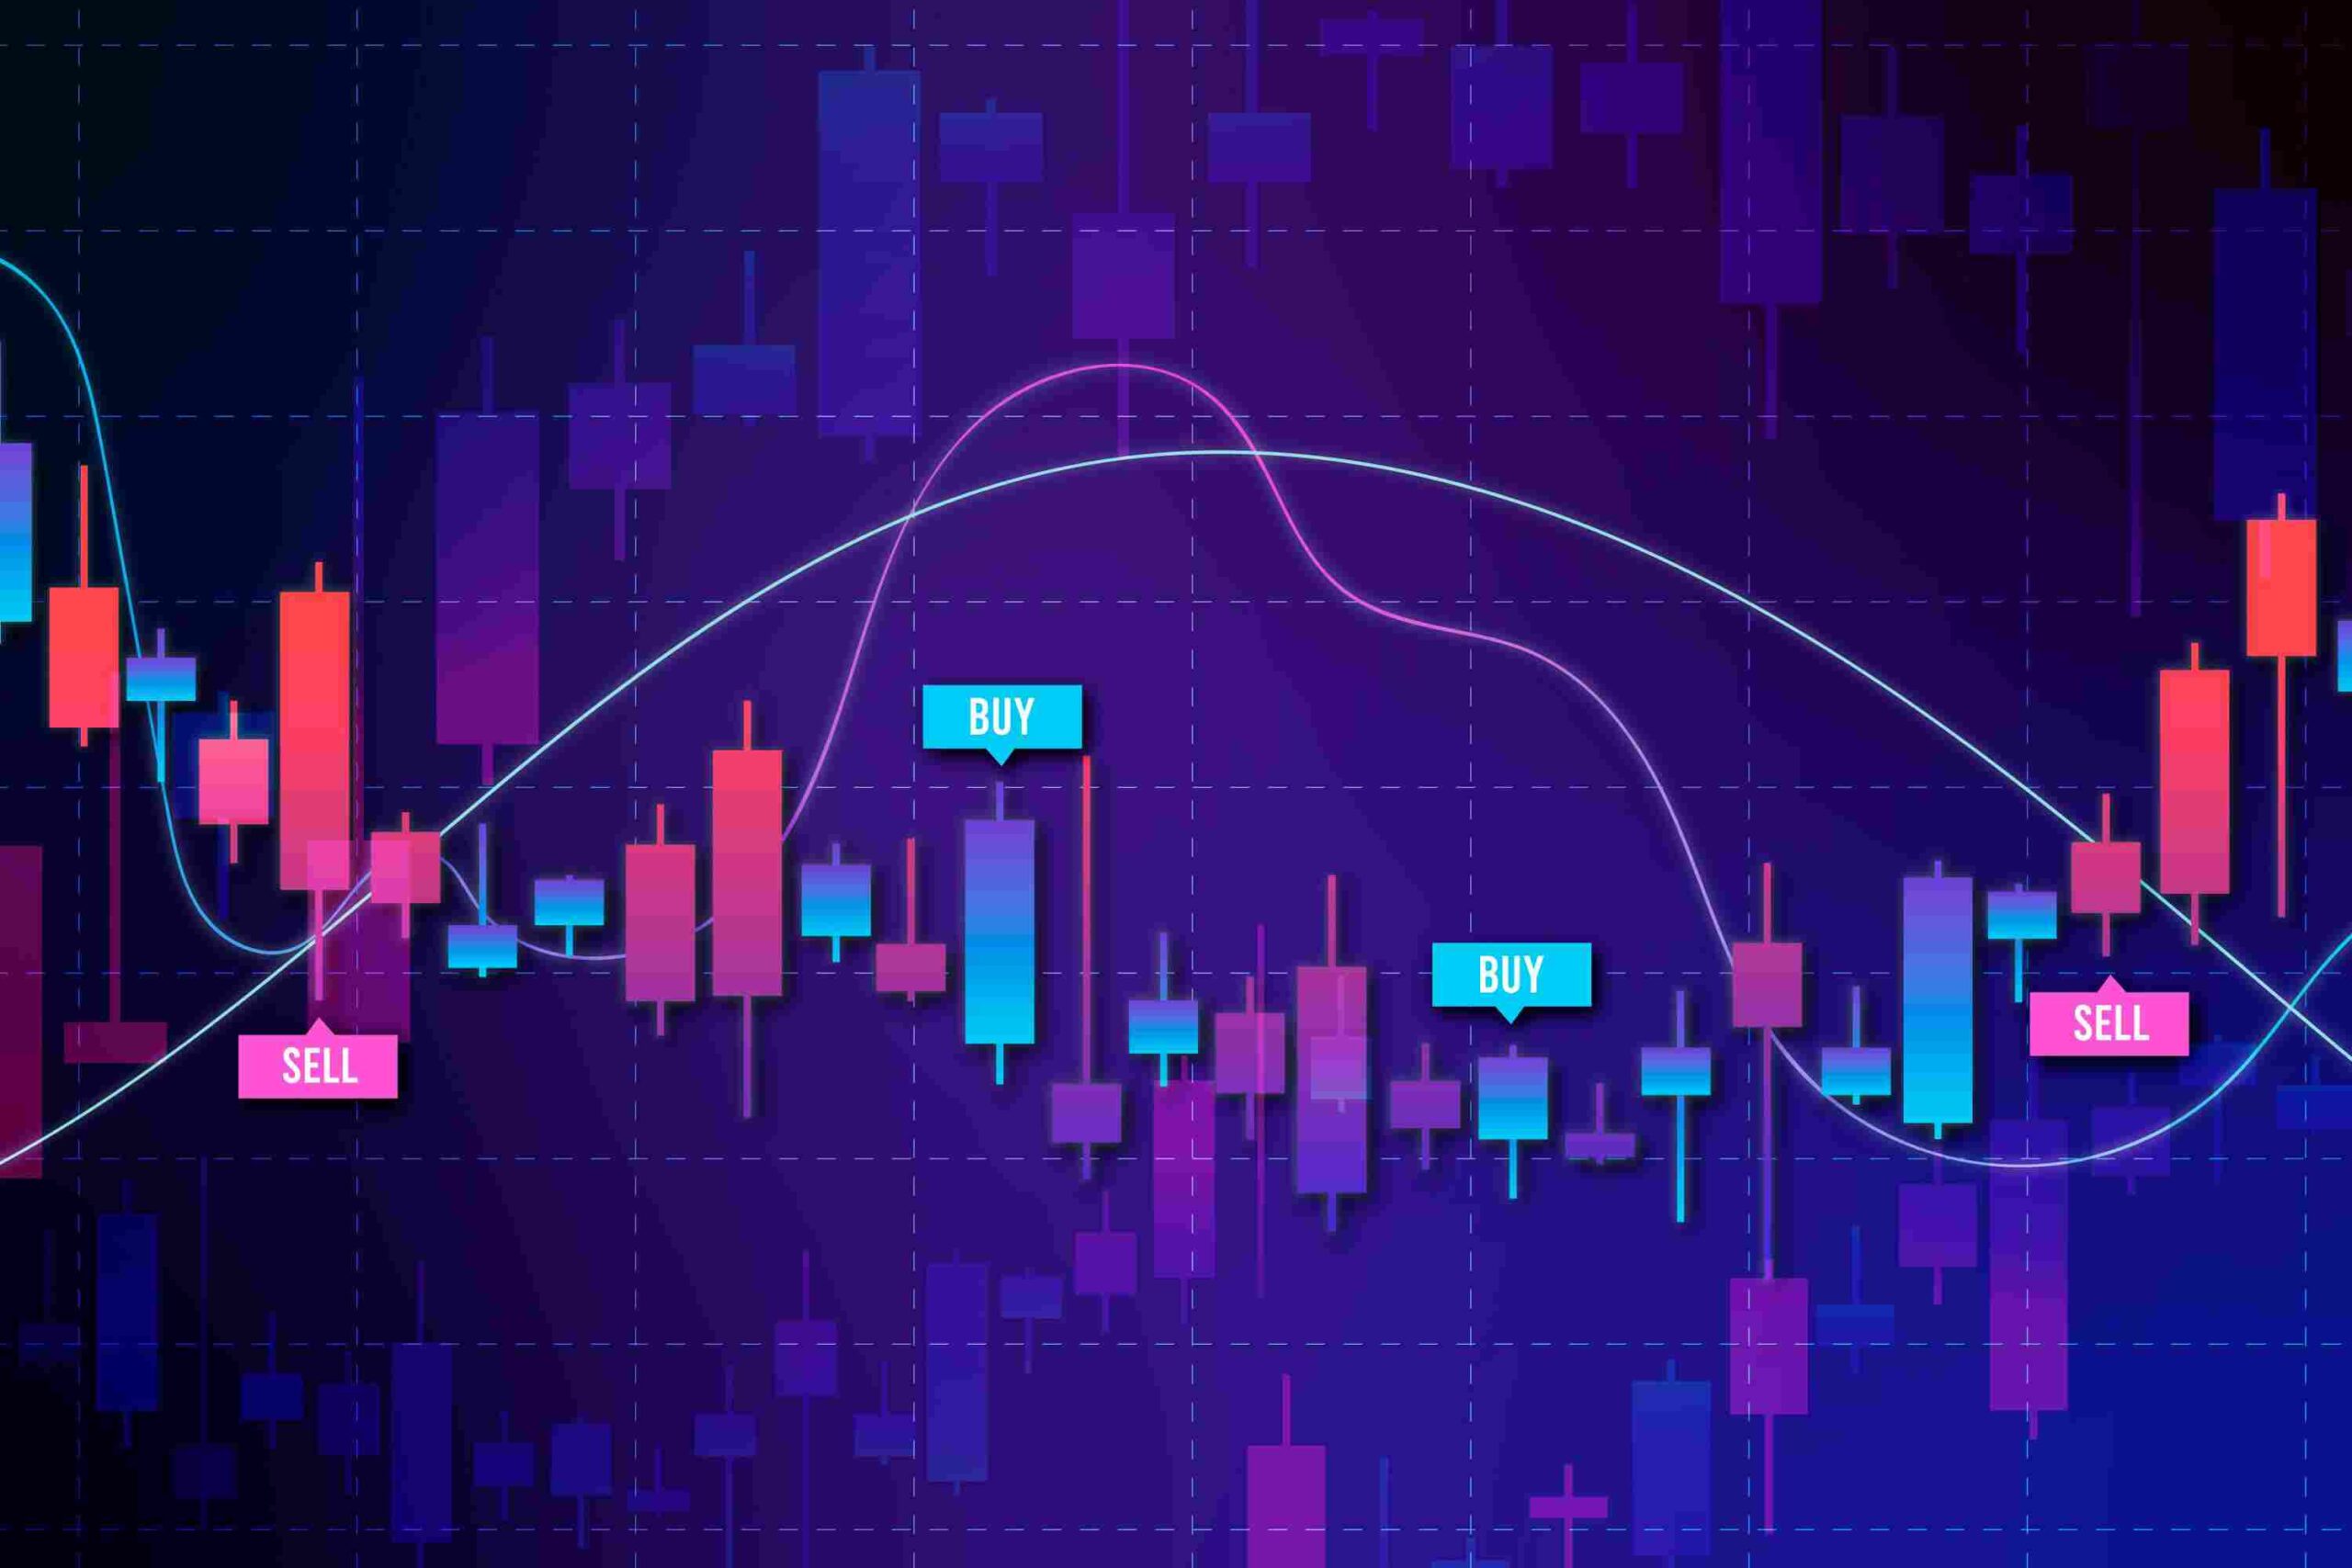
4. Chart and candlestick patterns
With time, prices trace repetitive shapes on the chart: these are your trading chart patterns, such as Head and Shoulders, Double Top/Bottom, flags, triangles and candlestick patterns, like Doji, Hammer, Engulfing, etc. They reflect market psychology, which is winning the tug-of-war between buyers and sellers at key support and resistance zones.
Patterns don’t predict the future. However, they can hint when a move is likely to continue or when a trend might be running out of steam.
Key supporting ideas:
sec2
A simple step-by-step forex technical analysis strategy
Have you thought of how to do technical analysis in forex? Here is a simple and beginner-friendly step-by-step guide on the ways to apply technical analysis.
Even though technical analysis won’t turn any trader into an expert overnight, it can help you build a clearer trading structure. Platforms and educational ecosystems like Zyvest Capital offer tools and learning resources that traders can use to keep refining their approach.
1. Select your pair and timeframe
Start with one forex pair and one main forex chart, for example, EUR/USD on the H1 timeframe for day trading. Focusing on one chart at any given time keeps your chart analysis cleaner, making it easier to recognise recurring trading chart patterns and price behaviour over time.
2. Find the Higher-Timeframe Trend
Check H4 or Daily to see if the broader market structure is bullish, bearish or ranging. This higher-timeframe trend usually aligns your trade with the dominant market price movements instead of fighting them.
3. Mark Key Support and Resistance Zones
Draw simple lines or boxes where the price has reversed multiple times. These support and resistance areas are places where supply and demand often shift, so they become your main decision zones on the chart.
4. Wait for a setup at those levels
Be patient and wait for price action at those zones. For example, a bounce in the direction of the trend or a basic trading chart pattern like a double bottom at strong support. This helps you avoid chasing random candles in the middle of nowhere.
5. Employ Indicators to Confirm
Add one or two technical indicators only, like RSI or moving averages, and use them to check whether signals align with the higher-timeframe trend. The indicators are there to confirm what you’re already seeing on the chart, not to replace your thoughts or fundamental analysis.
6. Define Entry, Stop-Loss and Take-Profit
Decide upon your entry, set your stop a little below the recent swing low in the case of buys or above the swing high in the case of sells, and set a reasonable risk-to-reward ratio, such as 1:2 or 1:3. Keeping the risk per trade small, for example, 1% of your account, can help one survive normal losing streaks.
7. Journal and Review the Trade
Take screenshots of your trades, and write down the reasons for entry, how you managed the trade, and how it was closed out. Regular review turns your trading strategy into a learning loop, instead of just a series of random bets.
sec2
Common mistakes in forex technical analysis
Before winding up this article, let us have a brief discussion on some of the common technical analysis mistakes in forex trading.
Too Many Indicators
You end up cluttering your forex chart with every technical indicator, which creates confusion and conflicting forex signals, thus making it hard to follow a simple trading strategy.
Ignoring Risk Management
Even with good technical analysis in forex, trading without clearly defined stop losses, proper position sizing, or a sensible risk-to-reward ratio can wipe out your account.
Forcing Trades in Flat Markets
The result of that is overtrading when trying to trade every tiny move inside the tight range instead of waiting for clean trends and clear support and resistance.
Believing Technical Analysis is “Magic”
Any patterns and indicators are showing only probabilities and not certainties, while the past price history and price patterns do not promise any results in a financial market.
Not Backtesting or Practicing on a Demo Account
Skipping backtesting and demo trading usually means that you have not properly tested your rules, which can make live trading more emotional and inconsistent.
sec4
Conclusion
As you have seen, technical analysis isn’t mysterious math or secret indicators; it’s a structured way of reading price, trends, and key levels so that your trading decisions become more deliberate and less emotional.
When someone asks what technical analysis is in forex trading, the real answer is simple: it’s a toolkit that helps you turn raw price movement into a clear plan for when to enter, when to exit, and how much to risk.
If you keep your framework simple, respect risk, and keep learning from every trade, then your charts will eventually stop being noise and start becoming information.
Employ demo accounts for practising, refine your rules very gradually, and remember that no strategy removes risk or guarantees profit. With time, consistent and disciplined use of technical analysis can turn into a solid ally throughout the entire forex journey.
Author Info
Uma Nair is a professional content writer with over 3 years of experience and a strong foundation in crafting engaging and informative content across diverse domains. Over the years, she has dealt with various niches, and her growing interest in finance has led her to explore the world of financial writing. As an English Language and Literature postgraduate, her educational background supports her ability to convey complex topics in easy and accessible content. In her free time, she stays updated on industry trends to continually enhance the value of her content.

Reviewed by
Abdul Latheef K is a Researcher at Jawaharlal Nehru University, New Delhi. He is also an Author, Educator, and Expert in personal finance and Investment. His areas of interest comprise the Stock Market, foreign capital flows, and Open Economy Macroeconomics.
Disclaimer:
The information provided on this blog is for general informational and educational purposes only and is not intended as financial, investment, legal, or tax advice. While we strive to ensure accuracy, completeness, and timeliness, the financial world is dynamic, and content may become outdated or subject to change. Always conduct your own research or consult with a qualified financial advisor before making any investment or financial decisions. The authors and publishers of this blog are not liable for any losses or damages arising from the use or reliance on the information presented.
sticky end
Recent Posts

Share this post
Pages
Plans
Legal
Zyvest Capital Prime Ltd (www.zyvest.com) is licensed and regulated by the Financial Services Commission (FSC) of Mauritius as an Investment Dealer (Full Service Dealer, Excluding Underwriting) under Licence No. GB25204874 | Code: SEC-2.1B, issued on 29 August 2025.
Risk Statement : An investment in derivatives may mean investors may lose an amount even greater than their original investment. Anyone wishing to invest in any of the products mentioned in www.zyvest.com should seek their own financial or professional advice. Trading of securities, forex, stock market, commodities, options and futures may not be suitable for everyone and involves the risk of losing part or all of your money. Trading in the financial markets has large potential rewards, but also large potential risk. You must be aware of the risks and be willing to accept them in order to invest in the markets. Don’t invest and trade with money which you can’t afford to lose. Forex Trading are not allowed in some countries, before investing your money, make sure whether your country is allowing this or not.
You are strongly advised to obtain independent financial, legal and tax advice before proceeding with any currency or spot metals trade. Nothing in this site should be read or construed as constituting advice on the part of Zyvest Capital Ltd. or any of its affiliates, directors, officers or employees.
Contracts for Difference (CFDs) are complex financial instruments and come with a high risk of losing money rapidly due to leverage. A significant percentage of retail investor accounts lose money when trading CFDs with providers. You should consider whether you understand how CFDs work and whether you can afford to take the high risk of losing your money.
CFDs are not suitable for all investors. Ensure you fully understand the risks involved and seek independent advice if necessary. Past performance is not a reliable indicator of future results. Please read our full Risk Disclosure Statement, Terms and Conditions, and Privacy Policy before engaging in any trading activity.
Disclaimer : Zyvest Capital Ltd. does not provide services for citizens/residents of the United States, Cuba, Iraq, Myanmar, North Korea, Sudan. The services of Zyvest Capital Ltd. are not intended for distribution to, or use by, any person in any country or jurisdiction where such distribution or use would be contrary to local law or regulation.